EXECUTIVE SUMMARY
In the United States, unlike other countries, the net prices of medications are generally treated as trade secrets; with information regarding a drug’s net price amount not readily available in the public domain. Since the passage of the anti-kickback statute and the establishment of the various safe harbors to it – including exemptions for drugmaker retrospective price concessions to insurers and pharmacy benefit managers (PBMs) – the list prices of branded prescription drugs, and the “rebate” payments by manufacturers to PBMs, have grown substantially.1
Numerous inquiries have demonstrated that the difference between list and net price (often referred to within the industry as the “gross-to-net bubble”) can be significant. Insulins have historically had rebates in excess of 80% of the drug’s list price.2 The best-selling drug of all time, Humira, also has had net prices that are below half the drug’s list price.3 Similarly, GLP-1s used for diabetes and weight loss treatment have similar levels of rebating that exceed 40% of the drug’s list price.4 So while each drug faces different gross-to-net realities, it is important to note that a drug’s list price is often not a proxy for its actual net cost – meaning that patient and plan sponsor payments for medicines based on list prices, and not their actual fully loaded discounted rate, can be cause significant financial hardship. For those patients and plan sponsors, maximizing the value of those rebates has proved to be difficult, as health insurers and PBMs have been found to be deploying a variety of tactics meant to reduce the amount of drugmaker price concessions that they have to pass on to the end payer.5 6 7 8
As our firm provides consulting and prescription drug benefit data analytics to a variety of plan sponsors and regulatory agencies, understanding the cost implications of lost rebates is a critical component of controlling prescription drug spend for our clients. While recent studies have sought to quantify the costs of the program to self-insured employers,9 this study seeks to demonstrate the costs to Taft-Hartley plans, also known as multi-employer welfare arrangements (MEWAs), through 340B discount preemption of manufacturer rebate payments. To quantify these costs, a financial model was created that demonstrated that the scale of the 340B program potentially reduces plan sponsor rebate collections to a meaningful
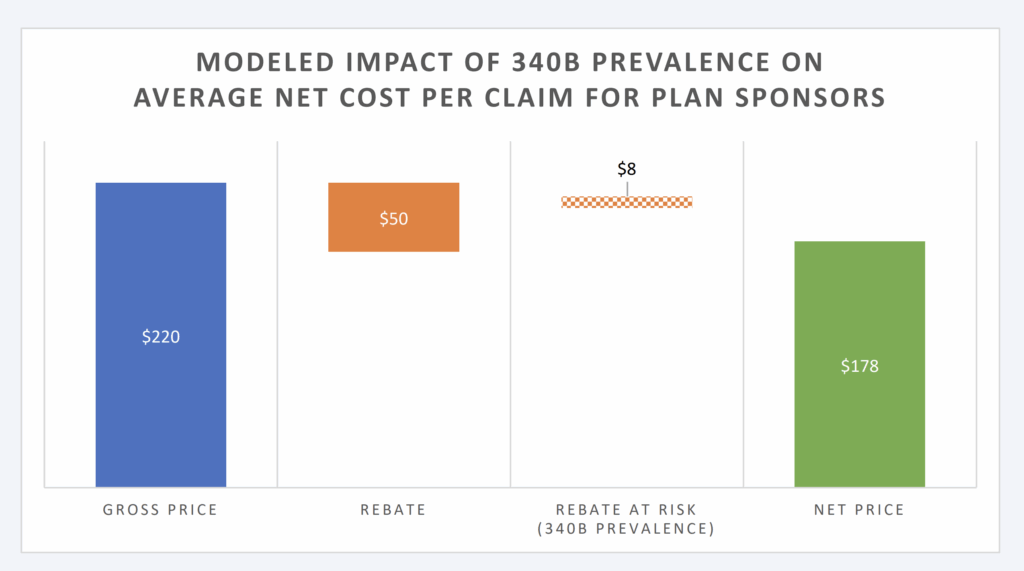
degree. Based upon the model constructed, 340B increases drug spending of TH plans by 4.7%, assuming 15% of brand claims are filled with 340B priced products that do not produce a rebate (Figure 1).
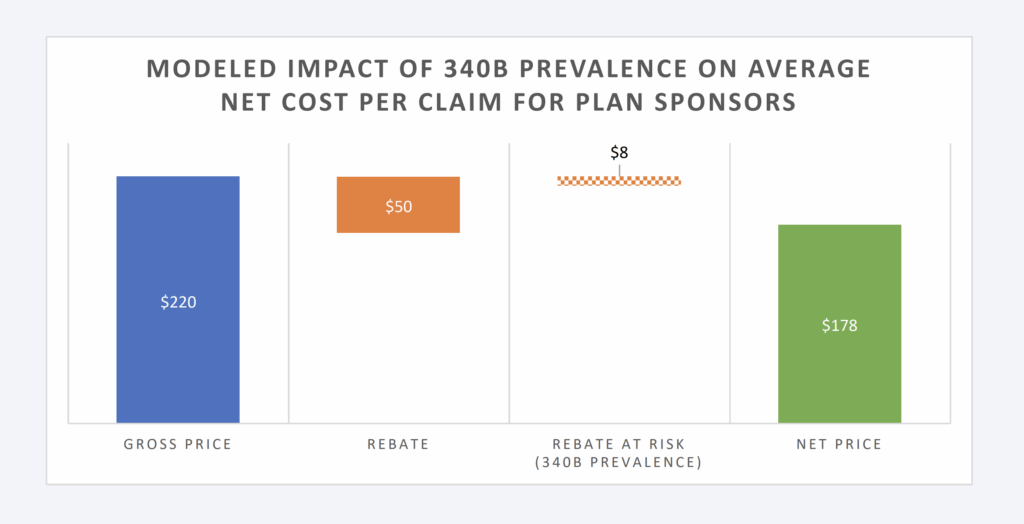
Figure 1: Modeled Impact of 340B Prevalence on Avg. Net Cost Per Claim
These cost risks to plan sponsors like Taft-Hartley plans increase as the size and scope of the 340B program grows over time. Most recent data from the U.S. Health Resources & Services Administration (HRSA) reveals that drug expenditures incurred through the 340B program eclipsed $66 billion in 2023, which is a yearover-year growth rate of 24%. As the 340B program continues to expand, patients and plan sponsors are left with increasing pressure to shoulder the costs of that growth. Specifically for Taft-Hartley plans, who maintain fiduciary obligations to their plan members, there is a compelling need to grapple with the financial burdens that the program can present in order to maximize the value they offer to their beneficiaries.
INTRODUCTION
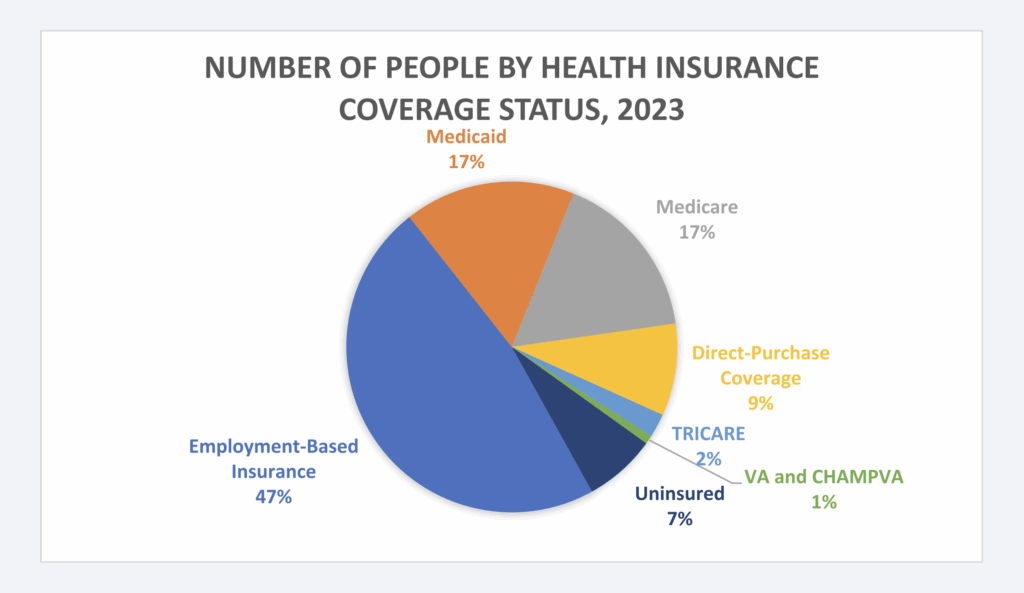
Healthcare in the United States operates through a complex, fragmented system of plan sponsors, with private insurance covering 65% of the population. Employer-based plans are the most common source of funding for healthcare benefits, followed by government programs of Medicare and Medicaid (Figure 3).10 However, employer-based plans vary significantly, influenced by geographic, employee, and industry specific factors. This diversity also extends to union-sponsored plans, particularly Taft-Hartley plans, which play a crucial role in providing healthcare and pension benefits for millions of workers across industries like construction, manufacturing, and transportation.11
Figure 3: Prevalence of Health Insurance Coverage, 202312
TAFT-HARTLEY
One of the potential sponsors of employer-based healthcare coverage is through participation in a union. Taft-Hartley plans, also known as multi-employer pension plans, multi-employer welfare arrangement (MEWA), or simply “multis,” are union-driven, collectively bargained agreements that provide benefits to enrollees. A Taft-Hartley plan allows workers in the same industry, but with different employers, to share health and pension benefits collectively. These plans offer unique advantages, such as benefit portability across employers, making them invaluable for industries with high employee turnover or individuals employed by multiple employers.13
Managed by a board of trustees that represents, in equal parts, both labor and management, these plans are subject to Employee Retirement Income Security Act (ERISA) regulations, ensuring fiduciary responsibility and financial oversight.14 In other words, Taft-Hartley plans are tasked with managing the plan and investing its funds to protect and deliver the benefits promised to workers and their families.15 This often comprises providing healthcare coverage, inclusive of prescription drug benefits. According to industry research, TaftHartley plans are facing rising health care and pharmacy costs within their plans, with 41% of plans requiring union members to share 11-20% of pharmacy costs.16
Often, one of the ways that drug prices are managed within health plans is through negotiating prescription drug rebates with drug manufacturers. Although brand drugs make up the majority of plan drug costs, they are often associated with significant rebates. In 2023, it was estimated that the total value of drug manufacturer price concessions and reductions was $334 billion (out of $722.5 billion).17 18 When a large percentage of brand drug pricing is potentially offset by a rebate, those concessions can be vital to the financial health of a plan’s benefit. The available evidence suggests that employers typically use rebates to offset overall healthcare costs and reduce general premiums, rather than reduce the out-of-pocket prices
paid by the patients whose prescriptions generated the rebate funds.19 20 Unsurprisingly, given the scale of their financial impact, plan sponsors often ascribe high importance to those rebate guarantees when selecting prescription drug coverage options.21
Recent evidence has demonstrated that the 340B program can have a material impact on plan sponsor rebate collections.22 This is because the 340B program relies upon payments from various health plan sources (e.g., Medicare and private health plans). Through purchasing drugs at low costs (i.e., 340B discounted price), a covered entity (i.e., those groups able to acquire drugs at 340B discounted prices) can generate revenues based upon the difference between their suppressed acquisition cost of the drug and the sale price of the medication to plan sponsors. However, because contracts between drug manufacturers, PBMs, and plan sponsors generally preclude the provision of a rebate if the claim was purchased at the 340B
discounted price (i.e., duplicate discount prohibition), the 340B discount can displace the rebate, resulting in higher net costs to plan sponsors (due to those claims not generating a rebate that otherwise would have but for the presence of the 340B program).23 24
340B PROGRAM
Because the 340B program provides discounted pricing on drug purchases, Congress effectively created a complex subsidy for 340B covered entities. Drug manufacturers are the first party responsible for subsidizing covered entities. Via the 340B program, covered entities are able to purchase drug inventory at a significant reduction in cost, beyond what they would otherwise negotiate in the typical commercial marketplace. According to the U.S. Health Resources and Services Administration (HRSA), which is responsible for administering the 340B program, enrolled hospitals and other covered entities can achieve average savings of 25% to 50% in pharmaceutical purchases.25 However, these averages can conceal savings of nearly 100% on select pharmaceuticals secured at 340B “penny pricing.”26 After securing low-cost inventory, covered entities rely upon the second source of their subsidy — insured individuals — to generate funding on these discounted drug purchases. This funding (i.e., the profit between sale price and actual purchase price) is intended to enable covered entities to deliver care to the uninsured or underinsured.
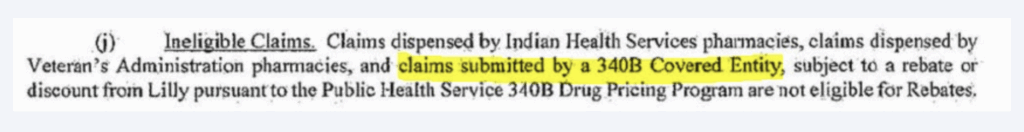
A critical challenge for plan sponsors is the interaction between manufacturer rebates and 340B discounts. Contracts provide that drug manufacturers will give rebates in exchange for favorable coverage of their medication within the plan benefit design.27 Rebates, in turn, lower the net cost of prescription drugs beyond what they would be without the rebate. The 340B discounts and the traditional rebates can both be substantial in size and are not intended to be paid on the same prescriptions (a scenario known as a duplicate discount). The law that created the 340B program contains provisions to prevent drugs purchased at a 340B discount from claiming Medicaid rebates.28 Drug manufacturers have generally applied the same principle (i.e., duplicate discount prohibitions) in their rebate contracts with other non-Medicaid sources of
healthcare coverage (Figure 4).29 30
Figure 4: Rebate Ineligible Claims, CVS & Eli Lilly Rebate Contract31
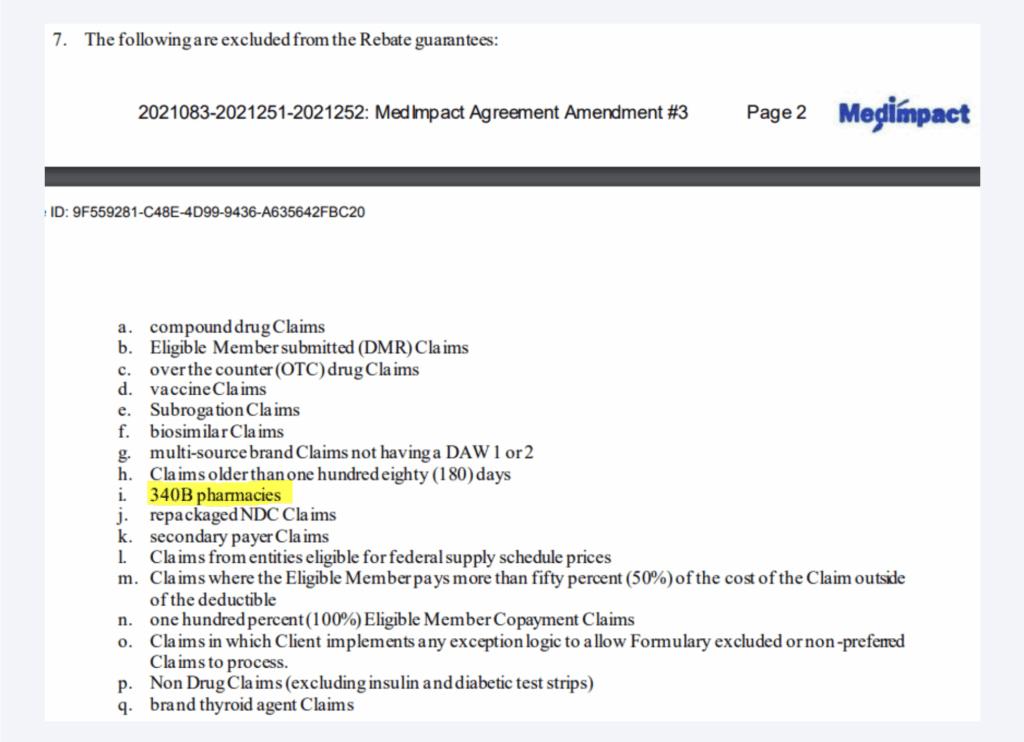
Because 340B discounts and traditional rebates are applied at different points in the supply chain, duplicate discounts are generally ‘prevented’ via denied rebates (as the sale to the provider has already been made before the plan request for rebate is made).32 As demonstrated in Figure 5, plan sponsors are generally aware of the 340B rebate preemption via language in their pharmacy benefit contracts.33
Figure 5: Rebate Guarantee Exclusions34
To be clear, the statute governing 340B provides discounted pricing on drug purchases. As a result, the 340B price is generally achieved before the rebate would be paid to the plan sponsor. This means that the drug manufacturer generally disputes or doesn’t pay invoice rebate requests on claims that were already purchased at a 340B discount. In some ways, the issue would appear to be a practical consideration, as manufacturers cannot “unsell’ the product to the covered entity (i.e., the medication was already purchased and dispensed to the patient), but they can forgo paying the rebate when requested (according to their
contract terms).
Given that healthcare premiums continue to rise, and given the public efforts of unions to secure healthcare benefits for their members as part of their collective bargaining efforts, our study seeks to understand the role that 340B purchases may play in increasing net drug costs to Taft-Hartley plans.35 36
CONSTRUCTION SPENDING
In order to estimate the impact of 340B purchases on net drug prices for Taft-Hartley plans, we need payment and utilization data alongside rebate and 340B prevalence estimates. We relied upon a data set of 44 private plan sponsors, representing $993 million in gross drug expenditures over approximately 450,000 claims in 2023. Claims data was differentiated into brand and generic claims. Brand prescription expenditures represented 89% of the $993 million gross plan expenses and 18% of the prescription volume. Generic claims were assumed to produce no rebates. Rebates for brand claims were estimated based upon the Federal Supply Schedule (FSS) pricing benchmark.37 38 The assumed rebate was the difference between the Wholesale Acquisition Cost (WAC) price and the FSS pricing benchmark for the national drug code (NDC) on the claim.a Pass-through of rebates was estimated to be at 100% based upon PBM testimony on rebate pass through and survey data.39 40 b
The prevalence of 340B claims was estimated to be 20% based upon estimates of 340B sales and 340B conversion for branded self-administered products.41 As we are studying the role of 340B sales against traditional plan rebates, no consideration was given to the impact on generic claims.
A financial model was built to describe the role of 340B claims within the health plan data. Factors in the model included 340B claim presence, assumed manufacturer rebates for branded medications, and rebates lost due to products purchased at a 340B discount price. We assumed manufacturer rebates were paid on non-340B-eligible drugs only (i.e., no duplicate discounts).
a To the extent that public information regarding commercial rebates was available, such as for insulin products, the FSS estimate of commercial rebates appeared accurate.
b While it does not appear any the Big 3 PBMs has stated 100% of all client rebates are 100% passed through, the purpose of this study is not to evaluate the role of withheld PBM rebates; so an assumption of 100% pass through avoids potentially confounding variables.
Nevertheless, it should be acknowledged that surveys, such as those conducted by the Kaiser Family Foundation (KFF), provide countervailing evidence that rebates are 100% passed through.
ANALYSIS
Within the data analyzed, the average cost per claim within the data set is $220 per paid claim. The average drug cost per paid brand claim is $1,111, whereas the average cost per paid generic claim is $31. The average rebate per brand claim is assumed to be $285 (25% discount off WAC list price for the collective brand prescriptions within the model).c
The financial model is perhaps easiest to understand at its extremes. In the absence of 340B claims (which means every brand claim would be eligible for its corresponding rebate), net plan expenditures are anticipated to be $170 per claim (23% reduction in plan expenditures from the gross price before rebates; i.e., $220). This experience, within the data, is a function of the drug mix, the brand-to-generic ratio, and the prevailing prescription drug payment rates and rebates for the dispensed medications. Additional factors like health status, age, socioeconomic status, and geographic considerations can also play a role in driving these figures, but they are outside the scope of the model.
In the presence of 100% of brand claims being 340B (which means every brand claim would be ineligible for traditional rebates), net plan expenditures would be $220; equal to the average cost per claim within the data set. When 25% (or more depending upon the therapy) of the collective brand drug list price is returned to plan sponsors via a rebate, failure to collect the retrospective price concession can dramatically increase plan expenses.
It is unlikely that any plan sponsor would have 100% of its claims dispensed by 340B providers; however, it is also unlikely that any plan sponsor would get 100% of brand claims rebated given the presence and growth of the 340B program.42 Rather, some level of 340B penetration occurs, resulting in lost rebates and increases to plan sponsors’ net drug expenditures.
Available estimates have our model presume that 15% of eligible brand claims will not produce a rebate due to the presence of 340B providers (and those providers’ purchase discounts pre-empting the plan sponsor from receiving a rebate). Under these conditions for plan sponsors, the net price per claim is estimated at $178 (compared to the $220 price without rebates or the $170 per claim if all eligible claims produced a rebate). This level of rebating would appear in-line with estimates of private health plan sponsor experience.43
cThe rebate is a slightly lower portion of brand claim expenditures due to a slight discount to WAC being recognized as total brand amount paid per claim.
Figure 6: Modeled Impact of 340B Prevalence on Avg Net Cost per Claim
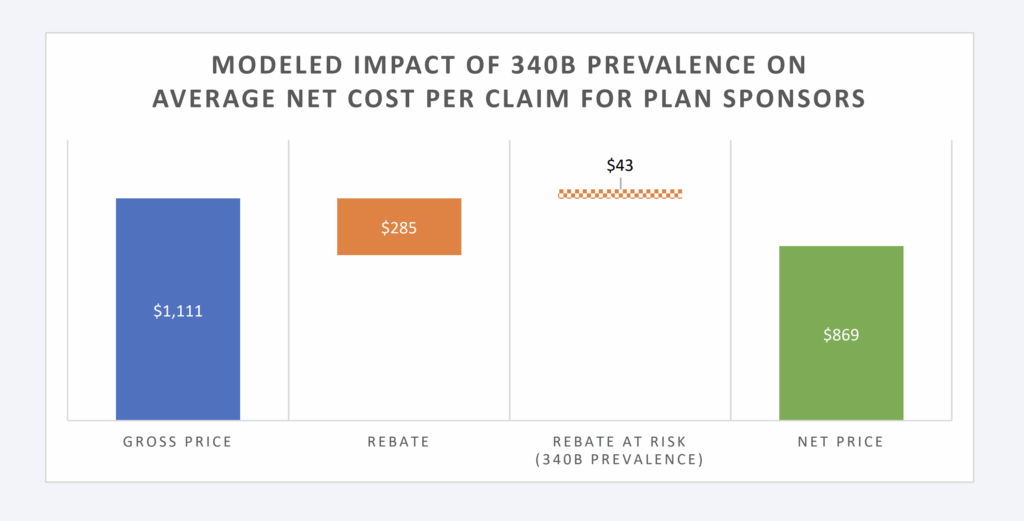
While Figure 6 provides the aggregate per claim impact, Figure 7 below provides the impact per brand claim. Rebates are produced on branded claims; however, the majority of claims (approximately 90%) are dispensed as generic drugs (which do not generate payer rebates). As a result, Figure 7 will show a greater impact on the reduction for the subset of claims most likely to be impacted by 340B (i.e., brands).
Figure 7: Modeled Impact per Brand Claim
Given that the model is directionally dependent upon the amount of rebates assumed to be foreclosed from plans due to the 340B program, it is possible to graph the proportional impact to net claim cost relative to the prevalence of 340B claims. As can be seen in Figure 8 below, the more claims that are 340B (as a percentage), the lower the plan rebates will be:
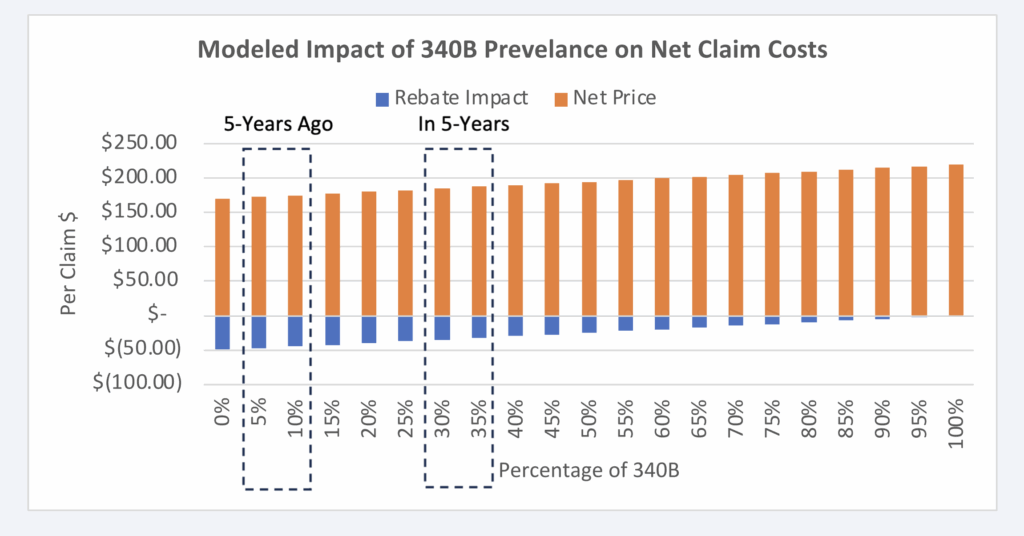
Figure 8: Impact of 340B Claim Prevalence on Net Claim Costs
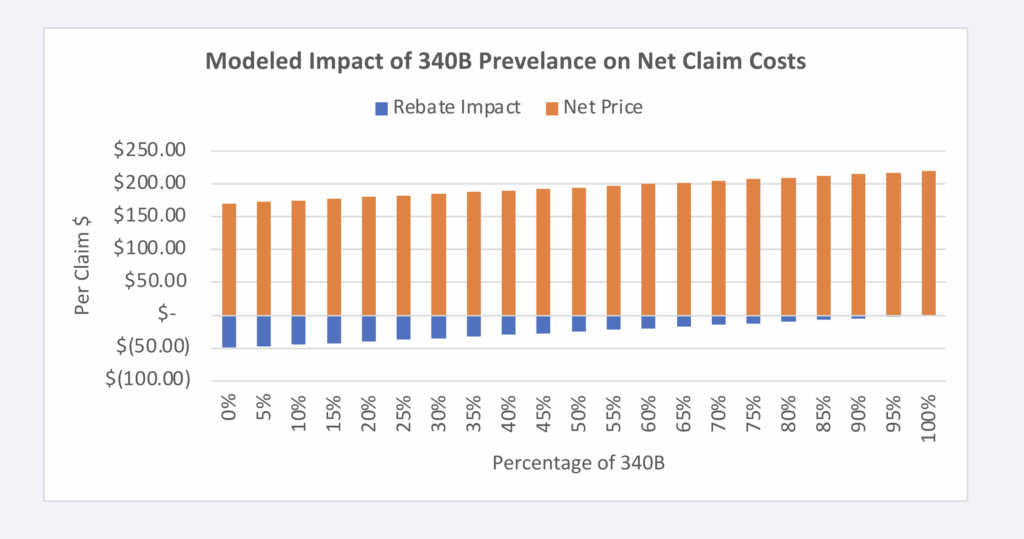
Figure 8 can allow for additional analysis of the potential growth or contraction of the 340B program. With estimated year-over-year growth of approximately 16%, we can use Figure 8 to evaluate what the impact was likely 5 years ago as well as what it’ll likely look like in 5 years (Figure 9).44
Figure 9: Estimated Impact +/- 5 years
DISCUSSION
Prescription drug prices in the United States are unlike prescription drug prices abroad. Drug manufacturers set the list price (i.e., wholesale acquisition cost, or WAC) of the drugs they sell to wholesalers and other large purchasers. Because of exemptions from federal anti-kickback laws, manufacturers also retrospectively pay government programs (Medicaid, Medicare, etc.) and pharmacy benefit managers (PBMs) or other entities in the drug supply chain, rebates (or other forms of price concessions) that meet certain volumebased or market-share criteria. The price resulting from the difference between the drug’s list price and all forms of drugmaker price concessions (rebates, fees, etc.) for that drug is often referred to as the drug’s “net price,”
In the United States, unlike other countries, the net prices of medications are generally treated as trade secrets, with information regarding a drug’s net amount not readily available in the public domain. Since the passage of the anti-kickback statute and the establishment of the various safe harbors – including exemptions for drugmaker retrospective price concessions to insurers and pharmacy benefit managers (PBMs) the list prices of branded prescription drugs, and the “rebate” payments by manufacturers to PBMs –have grown substantially.45
Numerous inquiries have demonstrated that the difference between list and net price (often referred to within the industry as the “gross-to-net bubble”) can be significant. Insulins have historically had rebates in excess of 80% of the drug’s list price.46 The best-selling drug of all time, Humira, also has had net prices that are below half the drug’s list price.47 Similarly, GLP-1s used for diabetes and weight loss treatment have similar levels of rebating that exceed 40% of the drug’s list price.48 So while each drug faces different gross-to-net realities, it is important to note that a drug’s list price is often not a proxy for its actual net cost – meaning that patient and plan sponsor payments for medicines based on list prices, and not their actual fully loaded discounted rate, can cause significant financial hardship. For those patients and plan sponsors,
maximizing the value of those rebates has proved to be difficult, as health insurers and PBMs have been found to be deploying a variety of tactics meant to reduce the amount of drugmaker price concessions that they have to pass on to the end payer.49 50 51 52
When 50% or more of the drug’s value is potentially returned to plan sponsors in the form of a rebate or other mechanism of discounting, practices that would impede the flow of price concessions, without a corresponding drop in the list price, would be harmful to payers of prescription drugs that currently receive and rely upon those rebates. While health insurers, PBMs, and other layers of the drug channel are receiving ample scrutiny for the practices used to withhold rebates from plan sponsors, one of the largest programs that can impede manufacturer prescription drug rebates from flowing through to the end payer is the 340B program.53 This program was created to drive best-in-class medicine discounts to provider groups rather than purchasers, with the premise that those provider-driven discounts could be used to buoy the healthcare services they offer to those who otherwise would not be able to afford them.54
While there is debate on whether all qualified providers are using these discounts as intended, regardless, 340B discounts can be sufficiently large (see “penny price” drugs) that it would be of negative value to provide 340B discounts on drug purchases and commercial rebates; thus, manufacturers contract in a way that precludes themselves from both providing a 340B purchase discount and a retrospective rebate to plan sponsors (a practice referred to as “duplicate discount” prohibitions). To put it plainly, if a drug company has given a best-in-class discount to a 340B provider – discounts that can be as large as 99% off the drug’s list price – that drug company won’t offer another payment to commercial plans for that same already discounted claim. This leaves the patient and plan sponsor in the financial quandary of having to pay for
increasingly expensive medicines based on their inflated gross prices without any rebate offsets.
The structure of drug manufacturer-to-PBM rebate contracts can create financial incentives for PBMs to favor drugs with higher rebates which, in turn, can increase utilization of these higher-cost drugs.55 56 It stands to reason that 340B covered entities—benefiting from discounts on drugs they purchase but reimbursed at higher rates—have similar incentives to prescribe medications with larger spreads between acquisition price relative to sale price.57 In a manner similar to the manufacture-to-rebate contract, 340B covered entities financial incentives can result in cost inflation for patients, due to copays and coinsurance tied to higher list prices. As way of example, one of the medications historically associated with significant patient affordability issues were insulin products; however, Novo Nordisk has identified that their insulin products were available to 340B covered entities for a penny.58 59 d This means that providers potentially had access to penny-priced insulin that patients were unaware of or could not access at low prices. In response to the dynamics of drug list prices, rebates, and 340B price concessions, calls for regulatory reform have emerged. Advocates raise potential policy changes such as eliminating rebate structures, enhancing transparency in drug pricing, or requiring rebates to be passed directly to patients at the point of sale to alleviate their financial burden.
A financial model was created that demonstrated that the scale of the 340B program potentially reduces plan sponsor rebate collections. Without any 340B claims overlapping manufacturer rebate payments to plan sponsors, the plan sponsor’s net price would be 5% lower.
These cost risks to plan sponsors like Taft-Hartley plans increase as the size and scope of the 340B program grows over time. Most recent data from the U.S. Health Resources & Services Administration (HRSA) reveals that drug expenditures incurred through the 340B program eclipsed $66 billion in 2023, which is a year over-year growth rate of 24%. As the 340B program continues to expand, patients and plan sponsors are left with increasing pressure to shoulder the costs of that growth. Specifically for Taft-Hartley plans, who maintain fiduciary obligations to their plan members, there is a compelling need to grapple with the financial burdens that the program can present in order to maximize the value they offer to their beneficiaries.
d340B penny pricing refers to a practice where manufacturers sell certain outpatient drugs to covered entities at a nominal cost of one penny per unit. This occurs when drug price increases would otherwise push the required 340B discount so high that it would essentially bring the drug’s price to zero, so a price of $0.01 is set instead.
ACKNOWLEDGEMENTS
This paper was informed by prior work of IQVIA – The Cost of the 340B Program Part 1: Self-Insured Employers.
LIMITATIONS
There are several limitations to fully understanding the impact of manufacturer rebates and other related concessions on drug pricing and utilization. First, the actual rebates provided by manufacturers are often unknown, making it difficult to gauge their effect on drug selection and costs. We know that not all brand drugs produce the same level of rebates, which means that our model may overestimate or underestimate rebate production, and thus, the corresponding impact to net drug prices, may be overestimated or underestimated.
Additionally, there is uncertainty around the extent to which these rebates are passed through, either by the PBM or directly to plan members, such as through point-of-sale rebates that could lower out-of-pocket costs. This lack of transparency hinders the ability to assess the true role rebates play in drug pricing, utilization, and net prices. It is documented that patient cost sharing amounts have a role in influencing prescription dispensing, and therefore, if plans share rebates at the point-of-sale with patients, the utilization patterns of high-rebate drugs may change in meaningful ways not specifically addressed within this study.60 As the majority of plans are not believed to share point-of-sale rebates, this limitation should generally not be applicable to most plans.61
PBM contracts often include minimum rebate guarantees per brand drug claim, which are designed to protect the value of rebate revenue to plan sponsors. These guarantees can be highly differentiated between PBMs and plans (for example, a plan may receive rebate offers from PBMs that are several hundreds of dollars different in scale per brand claim depending upon PBM, channel and other characteristics).62 This variability makes it challenging to determine how these guarantees might influence drug selection, rebate structures, and the impact on net drug spending. As we are assuming 100% rebate pass through, the impact of this limitation should be minimal given that the full value of rebates should generally exceed the
contracted rebate minimums. The model assumes an equitable distribution of brand drug claims that are dispensed by 340B providers.
However, the data demonstrates that the top 20 brand claims (by active ingredient) are responsible for 57% of the estimated rebates. If 340B claims are modeled to selectively come from these claims alone (possibly through self-selection by 340B providers based upon their financial incentives), then the impact to plan sponsors would be greater than what we modeled. It is documented that some claims, like insulin, have had historic ‘penny prices’ for 340B providers, while at the same time, it has been estimated that insulin rebates represented approximately 10% of all rebate collections.63 64 The incentive for 340B providers to selectively dispense medications they got for free may conflict with select drugs that have an outsized impact on commercial net prices.
These factors collectively obscure a clear understanding of rebate dynamics in the pharmaceutical supply chain.
REFERENCES
1 Fein AJ. PBM power: the gross-to-net bubble has reached $200 billion. Drug Channels. Published July 2024. Accessed November 1, 2024. https://www.drugchannels.net/2024/07/pbm-power-gross-to-net-bubblereached.html
2 Grassley C, Wyden R. Insulin: examining the factors driving increases in insulin prices and potential policy solutions. U.S. Senate Committee on Finance. Published 2019. Accessed November 1, 2024. https://www.finance.senate.gov/imo/media/doc/Grassley-Wyden%20Insulin%20Report%20(FINAL%201).pdf
3 Silverman E. Medicines prices: Humira biosimilar competition and pricing trends. STAT News. Published April 1, 2024. Accessed November 1, 2024. https://www.statnews.com/pharmalot/2024/04/01/medicinesprices-humira-biosimilar-novo-abbvie-lilly-mounjaro-diabetes-obesity-hiv/
4 Goforth, A. North Carolina ends coverage of GLP-1 weight-loss drugs for 750,000 state employees. BenefitsPRO. Published May 17, 2024. Accessed November 1, 2024. https://www.benefitspro.com/2024/05/17/north-carolina-ends-coverage-of-glp-1-weight-loss-drugs-for-750000-state-employees/?slreturn=20241112112459
5 Federal Trade Commission. FTC sues prescription drug middlemen for artificially inflating insulin drug
prices. Federal Trade Commission. Published September 20, 2024. Accessed November 1, 2024. https://
www.ftc.gov/news-events/news/press-releases/2024/09/ftc-sues-prescription-drug-middlemen-artificiallyinflating-insulin-drug-prices
6 Silverman E. Never mind the rebates. Maybe behind-the-scenes fees are boosting drug prices. STAT News. Published August 16, 2018. Accessed November 1, 2024. https://www.statnews.com/pharmalot/2018/08/16/rebates-fees-drug-prices/
7 Silverman E. CVS and its PBM agree to pay $45 million to Illinois for failing to pass drug rebates. STAT News. Published July 23, 2024. Accessed November 1, 2024. https://www.statnews.com/pharmalot/2024/07/23/cvs-caremark-pbm-illinois-medicines-rebates-ftc/
8 Herman, B, Silverman E. Express Scripts overcharged postal workers by $45 million, audit says. STAT News. Published July 22, 2024. Accessed November 1, 2024. https://www.statnews.com/pharmalot/2024/07/22/express-scripts-overcharged-postal-workers-by-45-million-audit-says/
9 IQVIA. The cost of the 340B program: part 1—self-insured employers. IQVIA. Published March 12, 2024. Accessed November 1, 2024. https://www.iqvia.com/locations/united-states/library/white-papers/the-costof-the-340b-program-part-1-self-insured-employers
10 U.S. Census Bureau. Health Insurance Coverage in the United States: 2023. U.S. Census Bureau. Published September 10, 2024. Accessed November 1, 2024. https://www.census.gov/library/publications/2024/demo/p60-284.html
11 SmartAsset. Taft-Hartley plans. SmartAsset. Published November 16, 2022. Accessed November 1, 2024. https://smartasset.com/financial-advisor/taft-hartley-plans-multiemployer-pension
12 U.S. Census Bureau. Table 1: Number of People by Health Insurance Coverage Status and Type: 2022 to U.S. Census Bureau. Published 2024. Accessed November 1, 2024. https://www2.census.gov/programssurveys/demo/tables/p60/284/table1.pdf
13 SmartAsset. Taft-Hartley plans. SmartAsset. Published November 16, 2022. Accessed November 1, 2024.
https://smartasset.com/financial-advisor/taft-hartley-plans-multiemployer-pension
14 John Hancock Retirement. Are Taft-Hartley plans subject to ERISA? John Hancock Retirement. Published January 15, 2020. Accessed November 1, 2024. https://retirement.johnhancock.com/us/en/viewpoints/taft-hartley/Are-Taft-Hartley-plans-subject-to-ERISA#:~:text=Yes%2C%20they%20are.,funds%20and%20fringe%20benefit%20funds.
15 Morgan Stanley. Taft-Hartley Plan Fundamentals. Morgan Stanley Graystone Consulting. Accessed November 1, 2024. https://www.morganstanley.com/content/dam/msdotcom/en/graystone/pdf/745505_3530738_GRAY_PDF_Taft-Hartley-Resource_Sheet_f1.pdf
16 Cigna. Capitalize on Taft-Hartley Research. Cigna. Accessed November 1, 2024. https://www.cigna.com/static/www-cigna-com/docs/taft-hartley-fund-managers-needs.pdf
17 https://www.drugchannels.net/2024/07/pbm-power-gross-to-net-bubble-reached.html#:~:text=What%20is%20the%20gross%2Dto,%2C%20discounts%2C%20and%20other%20reductions.
18 Tichy, EM, Hoffman, JM, Tadrous, M, et al. National trends in prescription drug expenditures and projects for 2020. Am J Health Syst Pharm. Published July 8 2024. Accessed November 1 2024. https://pubmed.ncbi.nlm.nih.gov/38656319/#:~:text=Results:%20In%202023%2C%20overall%20pharmaceutical,from%20price%20and%20new%20products
19 Klaisner, J, Holcomb, K, Filipek, T. Impact of Potential Changes to the Treatment of Manufacturer Rebates. Published January 31, 2019. Accessed November 1, 2024. https://aspe.hhs.gov/sites/default/files/private/pdf/260591/MillimanReportImpactPartDRebateReform.pdf
20 Fein AJ. Surprising data on employer-PBM rebate pass-through arrangements in 2023. Drug Channels. Published August 15, 2023. Accessed November 1, 2024. https://www.drugchannels.net/2023/08/surprisingdata-on-employer-pbm-rebate.html
21 Henderson, R, Patterson, J. Prescription Rebate Guarantees: Employer Insights. AJMC. Published July 19, 2024. Accessed November 1, 2024. https://www.ajmc.com/view/prescription-rebate-guarantees-employerinsights
22 IQVIA. The cost of the 340B program: part 1—self-insured employers. IQVIA. Published March 12, 2024. Accessed November 1, 2024. https://www.iqvia.com/locations/united-states/library/white-papers/the-costof-the-340b-program-part-1-self-insured-employers
23 IQVIA. The cost of the 340B program: part 1—self-insured employers. IQVIA. Published March 12, 2024. Accessed November 1, 2024. https://www.iqvia.com/locations/united-states/library/white-papers/the-costof-the-340b-program-part-1-self-insured-employers
24 City of Mesa. Amendment #3 to Agreement to Pursuant to Solicitation 20210803-2021251-2021252 Commercial and Employer Group Waiver Program Medicare Part D and WRAP Pharmacy Benefit Manager Services. City of Mesa. June 23, 2021. Accessed November 1, 2024. https://apps.mesaaz.gov/purchasingcontracts/Documents/%7B00E66556-47E7-4E44-929C-B93530D0C379%7D_0.pdf
25 American Hospital Association. Fact sheet: 340B Drug Pricing Program. American Hospital Association. Published March 2023. Accessed November 1, 2024. https://www.aha.org/fact-sheets/fact-sheet-340bdrug-pricing-program#:~:text=According%20to%20the%20Health%20Resources,to%2050%25%20in%20-pharmaceutical%20purchases.
26 Health Resources and Services Administration. What is HRSA’s penny-pricing policy regarding 340B ceiling prices? Health Resources and Services Administration. Published July 2020. Accessed November 1, 2024. https://www.hrsa.gov/about/faqs/what-hrsas-penny-pricing-policy-regarding-340b-ceilingprices#:~:text=340B%20ceiling%20prices-,What%20is%20HRSA’s%20penny%2Dpricing%20policy%20regarding%20340B%20ceiling%20prices,July%202020
27 Federal Trade Commission. FTC sues prescription drug middlemen for artificially inflating insulin drug
prices. Federal Trade Commission. Published September 20, 2024. Accessed November 1, 2024. https://
www.ftc.gov/news-events/news/press-releases/2024/09/ftc-sues-prescription-drug-middlemen-artificiallyinflating-insulin-drug-prices
28 Health Resources and Services Administration. Medicaid exclusion file. Health Resources and Services Administration. Accessed November 1, 2024. https://www.hrsa.gov/opa/program-requirements/medicaidexclusion
29 42 USC 256b(a)(5)(A)(i)
30 City of Mesa. Amendment #3 to Agreement to Pursuant to Solicitation 20210803-2021251-2021252 Commercial and Employer Group Waiver Program Medicare Part D and WRAP Pharmacy Benefit Manager Services. City of Mesa. June 23, 2021. Accessed November 1, 2024. https://apps.mesaaz.gov/purchasingcontracts/Documents/%7B00E66556-47E7-4E44-929C-B93530D0C379%7D_0.pdf
31 U.S. Senate Committee on Finance. Documents Produced by CVS Caremark. U.S. Senate Committee on Finance. Published 2019. Accessed November 1, 2024. https://www.finance.senate.gov/imo/media/doc/_FINAL%20PDF%20-%20CVS%20Caremark_Redacted.pdf
32 IQVIA. The cost of the 340B program: part 1—self-insured employers. IQVIA. Published March 12, 2024. Accessed November 1, 2024. https://www.iqvia.com/locations/united-states/library/white-papers/the-costof-the-340b-program-part-1-self-insured-employers
33 City of Mesa. Amendment #3 to Agreement to Pursuant to Solicitation 20210803-2021251-2021252 Commercial and Employer Group Waiver Program Medicare Part D and WRAP Pharmacy Benefit Manager Services. City of Mesa. June 23, 2021. Accessed November 1, 2024. https://apps.mesaaz.gov/purchasingcontracts/Documents/%7B00E66556-47E7-4E44-929C-B93530D0C379%7D_0.pdf
34 City of Mesa. Amendment #3 to Agreement to Pursuant to Solicitation 20210803-2021251-2021252 Commercial and Employer Group Waiver Program Medicare Part D and WRAP Pharmacy Benefit Manager Services. City of Mesa. June 23, 2021. Accessed November 1, 2024. https://apps.mesaaz.gov/purchasingcontracts/Documents/%7B00E66556-47E7-4E44-929C-B93530D0C379%7D_0.pdf
35 Green, K. Rising healthcare costs. UnionTrack. Published December 12, 2023. Accessed November 1, 2024. https://uniontrack.com/blog/healthcare-benefits#:~:text=Rising%20Healthcare%20Costs&text=%E2%80%9CThe%20bulk%20of%20the%20research,tried%20to%20introduce%20in%202022.
36 KFF. Annual family premiums for employer coverage rise 7% to average $25,572 in 2024, benchmark survey finds. KFF. Published October 9, 2024. Accessed November 1, 2024. https://www.kff.org/health-costs/press-release/annual-family-premiums-for-employer-coverage-rise-7-to-average-25572-in-2024-benchmark-survey-finds-after-also-rising-7-last-year/#:~:text=Family%20premiums%20for%20employer%2Dsponsored,that%20premiums%20are%20up%207%25.
37 3 Axis Advisors. Estimates of U.S. brand drug commercial net prices. 3 Axis Advisors. Published February 15, 2023. Accessed November 1, 2024. https://www.3axisadvisors.com/projects/2023/2/15/estimates-of-usbrand-drug-commercial net-prices
38 Congressional Budget Office. A Comparison of Brand-Name Drug Prices Among Selected Federal Programs. Congressional Budget Office. Published February 2021. Accessed November 1, 2024. https://www.cbo.gov/publication/57007
39 U.S. Government Accountability Office. Medicare Part D: Use of Pharmacy Benefit Managers and Efforts to Manage Drug Expenditures and Utilization. U.S. Government Accountability Office. Published July 2019. Accessed November 1, 2024. https://www.gao.gov/assets/gao-19-498.pdf
40 The Pew Charitable Trusts. The prescription drug landscape explored. The Pew Charitable Trusts. Published March 8, 2019. Accessed November 1, 2024. https://www.pewtrusts.org/en/research-and-analysis/reports/2019/03/08/the-prescription-drug-landscape-explored
41 IQVIA. The cost of the 340B program: part 1—self-insured employers. IQVIA. Published March 12, 2024. Accessed November 1, 2024. https://www.iqvia.com/locations/united-states/library/white-papers/the-costof-the-340b-program-part-1-self-insured-employers
42 Martin, R, Karne, H. The 340B Drug Discount Program Grew to $124B in 2023. IQVIA. Published 2024. Accessed November 1, 2024. https://www.iqvia.com/-/media/iqvia/pdfs/us/white-paper/2024/iqvia-updateon-size-of-340b-program-report-2024.pdf
43 Plummer, E, Socal, M, Ballreich, JM, et al. Trends in Prescription Drug Manufacturer Rebates in Commercial Health Insurance Plans, 2015-2019. JAMA Health Forum. Published 2022. Accessed November 1, 2024. https://pmc.ncbi.nlm.nih.gov/articles/PMC9077484/#:~:text=Median%20Rebate%25%20grew%20steadily%20
for,and%20large%20group%20plans%2C%20respectively.&text=Figure.&text=Rebate%25%20was%2-0measured%20as%20a,001).
44 Martin, R, Karne, H. The 340B Drug Discount Program Grew to $124B in 2023. IQVIA. Published 2024. Accessed November 1, 2024. https://www.iqvia.com/-/media/iqvia/pdfs/us/white-paper/2024/iqvia-updateon-size-of-340b-program-report-2024.pdf
45 Fein AJ. PBM power: the gross-to-net bubble has reached $334 billion in 2023. Drug Channels. Published July 16, 2024. Accessed November 1, 2024. https://www.drugchannels.net/2024/07/pbm-power-gross-tonet-bubble-reached.html
46 Grassley C, Wyden R. Insulin: examining the factors driving increases in insulin prices and potential policy solutions. U.S. Senate Committee on Finance. Published 2019. Accessed November 1, 2024.
47 Silverman E. Net prices for medicines fell considerably in 2023’s last quarter, mostly thanks to Humira biosimilars. STAT News. Published April 1, 2024. Accessed November 1, 2024. https://www.statnews.com/pharmalot/2024/04/01/medicines-prices-humira-biosimilar-novo-abbvie-lilly-mounjaro-diabetes-obesityhiv/
48 Goforth, A. North Carolina ends coverage of GLP-1 weight-loss drugs for 750,000 state employees. BenefitsPRO. Published May 17, 2024. Accessed November 1, 2024. https://www.benefitspro.com/2024/05/17/north-carolina-ends-coverage-of-glp-1-weight-loss-drugs-for-750000-state-employees/?slreturn=20241112112459
49 Federal Trade Commission. FTC sues prescription drug middlemen for artificially inflating insulin drug prices. Federal Trade Commission. Published September 20, 2024. Accessed November 1, 2024. https://www.ftc.gov/news-events/news/press-releases/2024/09/ftc-sues-prescription-drug-middlemen-artificiallyinflating-insulin-drug-prices
50 Silverman E. Never mind the rebates. Maybe behind-the-scenes fees are boosting drug prices. STAT News. Published August 16, 2018. Accessed November 1, 2024. https://www.statnews.com/pharmalot/2018/08/16/rebates-fees-drug-prices/
51 Silverman E. CVS and its PBM agree to pay $45 million to Illinois for failing to pass drug rebates. STAT News. Published July 23, 2024. Accessed November 1, 2024. https://www.statnews.com/pharmalot/2024/07/23/cvs-caremark-pbm-illinois-medicines-rebates-ftc/
52 Herman, B, Silverman E. Express Scripts overcharged postal workers by $45 million, audit says. STAT News. Published July 22, 2024. Accessed November 1, 2024. https://www.statnews.com/pharmalot/2024/07/22/express-scripts-overcharged-postal-workers-by-45-million-audit-says/
53 Fein AJ. Drug Channels News Roundup, September 2024: Inside JNJ’s Gross-to-Net Bubble, Optum Rx’s Private Label Biosimilars, Where Biosimilars Boom, Accumulators vs. Patients, and Steve Collis Retires. Drug Channels. Published September 24, 2024. Accessed November 1, 2024. https://www.drugchannels.net/2024/09/inside-jnjs-gross-to-net-bubble-optum.html
54 American Hospital Association. Fact sheet: 340B Drug Pricing Program. American Hospital Association. Published March 2023. Accessed November 1, 2024. https://www.aha.org/fact-sheets/fact-sheet-340bdrug-pricing program#:~:text=According%20to%20the%20Health%20Resources,to%2050%25%20in%20
pharmaceutical%20purchases.
55 The Commonwealth Fund. Pharmacy benefit managers and their role in drug spending. The Commonwealth Fund. Published April 22, 2019. Accessed November 1, 2024. https://www.commonwealthfund.org/publications/explainer/2019/apr/pharmacy-benefit-managers-and-their-role-drugspending#:~:text=The%20federal%20Centers%20for%20Medicare,out%2Dof%2Dpocket%20costs.
56 Federal Trade Commission. FTC sues prescription drug middlemen for artificially inflating insulin drug prices. Federal Trade Commission. Published September 20, 2024. Accessed November 1, 2024. https://www.ftc.gov/news-events/news/press-releases/2024/09/ftc-sues-prescription-drug-middlemen-artificiallyinflating-insulin-drug-prices
57 Thomas, S, Schulman, K. The unintended consequences of the 340B safety-net drug discount program. Health Serv Res. Published March 2020. Accessed November 1, 2024. https://pmc.ncbi.nlm.nih.gov/articles/PMC7080379/
58 Health Resources and Services Administration. What is HRSA’s penny-pricing policy regarding 340B ceiling prices? Health Resources and Services Administration. Published July 2020. Accessed November 1, 2024. https://www.hrsa.gov/about/faqs/what-hrsas-penny-pricing-policy-regarding-340bceilingprices#:~:text=340B%20ceiling%20prices-,What%20is%20HRSA’s%20penny%2Dpricing%20policy%20regarding%20340B%20ceiling%20prices,July%202020
59 Eli Lilly & Company. Update to Lilly’s contract pharmacy limited distribution system. Eli Lilly & Company. Published June 19, 2024. Accessed November 1, 2024. https://www.amerisourcebergen.com/-/media/assets/amerisourcebergen/340b/manf-letters/20240619-lilly-claimsrequirement-eff-20240701.pdf
60 National Pharmaceutical Council. Cost sharing and adherence, clinical outcomes, health care utilization, and costs—a systematic literature review. National Pharmaceutical Council. Published April 7, 2022. Accessed November 1, 2024. https://www.npcnow.org/resources/cost-sharing-and-adherence-clinical-outcomeshealth-care-utilization-and-costs-systematic#:~:text=decreased%20medication%20initiation.-,Health%20-Care%20Resource%20Utilization,sharing%20and%20emergency%20department%20visits
61 Fein AJ. Employers slowly warm to point-of-sale rebates. Drug Channels. Published September 19, 2019. Accessed November 1, 2024. https://www.drugchannels.net/2019/09/employers-slowly-warm-to-point-ofsale.html
62 San Juan County Board of Commissioners. Agenda Items: Insurance Renewal Options Presentation and Discussion. San Juan County. Published 2022. Accessed November 1, 2024. https://www.utah.gov/pmn/files/901597.pdf
63 U.S. Senate Committee on Finance. Documents Produced by Novo Nordisk. U.S. Senate Committee on Finance. Published 2019. Accessed November 1, 2024. https://www.finance.senate.gov/imo/media/doc/Novo_Redacted.pdf
64 Dickson, SR, Gabriel N, Gellad, WF, et al. Assessment of Commercial and Mandatory Discounts in the Gross-to-Net Bubble for the Top Insulin Products from 2012 to 2019. JAMA Network. Published June 14,
Accessed November 1, 2024. https://jamanetwork.com/journals/jamanetworkopen/fullarticle/2806016